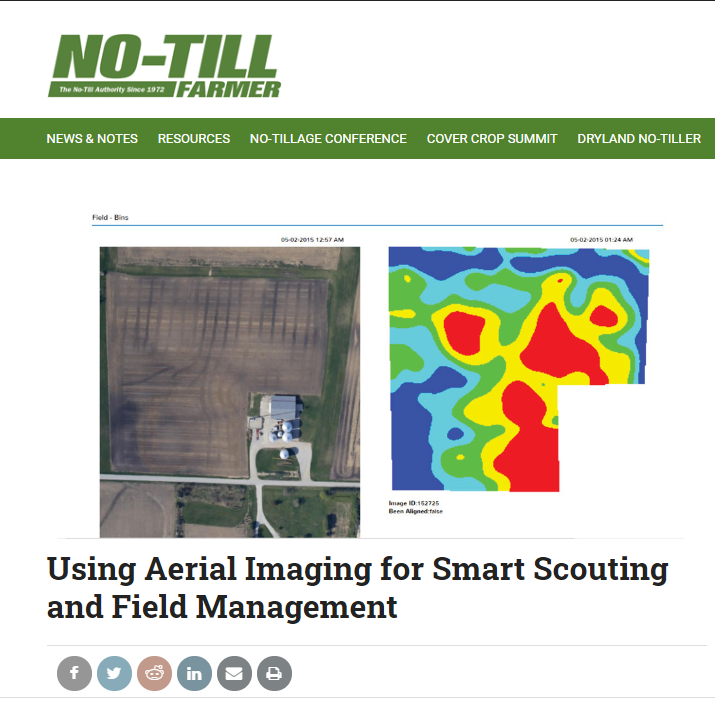
For aerial imaging to be worthwhile it has to lead to changes in farm management that improve profits and efficiency, says AirScout co-founder Dan Sutton.
Pictured Above: TRUE POTENTIAL. AirScout uses bare soil images (left) to build a prescription planting map (right). The darker soils contain more organic matter and can support higher corn populations, while lighter areas have lower yield potential.
Earlier this year, Dan Sutton asked attendees at the National No-Tillage Conference for a show of hands to indicate how many farmers in the room had seen aerial imagery of their farms in the past 5 years. Almost all the hands in the room went up.
But not nearly as many hands were raised when the co-founder of ag imaging company AirScout asked them if they had changed farming practices as a result of those images.
“That’s the problem with aerial imaging in our industry,” said Sutton. “And we hope to change that.”
Launched in 2010 by farmer brothers Dan and Brian Sutton of Lowell, Ind., AirScout provides farmers with field images throughout the growing season taken from fixed-wing aircraft featuring regular visual images, as well as proprietary thermal and ADVI imagery — Brian’s patented version of normalized difference vegetative index (NDVI), which is usually used to detect live vegetation.
By Farmers, For Farmers
Nate Douridas, farm manager at the Molly Caren Agricultural Center at Ohio State University, says their farm started using AirScout imagery on a limited acreage in 2015 but is now using the service on all 1,375 cropping acres.
“The unique thing about this imagery is that they provide 10-plus image flights throughout the season, starting with bare soil … and then going through the growing season all the way to just before harvest.”
In addition, he points to the Suttons’ farming experience. “When a tool is developed by a farmer, it tends to be very useable,” he explains. “They know what we’re looking for.”
Expanding the Visible Spectrum
Each AirScout flight delivers a series of 3 images — a visual image, an ADVI image and a thermal image. According to Douridas, each image has a unique value.
He finds the early-season visual images are a useful way to see what’s happened on the land over the past year, such as erosion, residue management, flooding events and any kind of soil disturbance.
The thermal images reveal warmer and cooler areas, which can indicate different issues throughout the season. For instance, they can identify well-drained or poorly drained areas, helping farmers decide whether fields are ready for planting or need additional future work to improve drainage.
They’re are also really helpful when it’s time to make replant decisions, according to Douridas.
“In 2017, we had a lot of replant that had to happen. The areas where we felt it was necessary to replant correlated very well with some of the thermal maps from AirScout,” Douridas says.
“We also use them in-season to detect disease prevalence so we can decide where to focus our efforts. If I try to tackle the entire 700 acres of corn on the farm I could easily miss some cues.
“The technology lets me focus and say, for instance, ‘OK, it looks like these areas that correlate with the warmer areas on the thermal map show the beginning of a disease.’ And after visiting those fields, I can decide if I need to hire a critical application right away or wait a couple of days to see how it’s progressed or changed.”
ADVI looks at the vegetative areas of a field, but expands the visible spectrum from seeing only shades of green to include browns as well, which Sutton says allows them to map the levels of organic matter in the soil and predict yield potential. Independent soil analysis on their own ground has verified this correlation, according to Sutton.
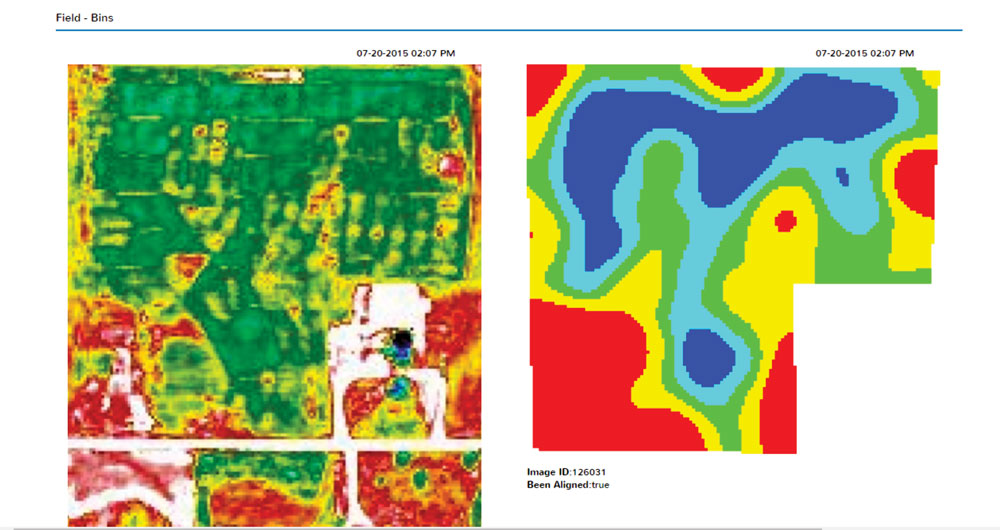 DISEASE MANAGEMENT. The blue and green areas of this AirScout thermal image (left) show cool spots that aren’t under a lot of stress while the red areas may indicate the onset of disease. This builds the map for variable-rate fungicide application (right).
As the season progresses, the ADVI images offer information about the health of the growing plants. Douridas is most interested in how the ADVI images can help direct their N management.
“In Ohio, many farmers are starting to start focusing on variable-rate nitrogen,” says Douridas. “The ADVI program, along with their nitrogen tool, is one way growers could do that because nitrogen can be so challenging to manage and it can be different from year to year.”
Douridas says one of his first ‘ah-ha’ moments with the value of the AirScout imagery had to do with compaction. The ADVI images showed stunted growth across four to six rows, spaced 40 feet apart, which was verified in the field and correlated with the center tires on the 40-foot planter and tractor tires.
“Without AirScout’s ADVI images, we wouldn’t have realized we were creating compaction in certain field operations and not managing compaction as well as we needed to,” he says.
This convinced him to migrate some equipment over to tracks., including the corn planter, grain cart undercarriage and a tractor. He’s also become more careful about when he goes into a field and postpones operations if the conditions aren’t right. In addition, the farm started using controlled traffic whenever possible to help confine compaction to specific places.
More Than Images
To help farmers make use of their images, AirScout has an app that houses the images and uses them to create prescriptions for seeding and N applications, as well as identifying potential solutions for pest, disease and water stress.
Sutton says that building a seeding prescription begins with the visual image, which shows darker and lighter areas that correlate with higher and lower levels of organic matter respectively.
Next, they apply the ADVI filter to the image, which breaks the field into zones based on user inputs including minimum and maximum seeding rates for the specific crops being planted.
 “If I want to put the nitrogen in the right spot at the right time, I need an image of now, today, right before I’m ready to put the nitrogen on…” – Dan Sutton
“So I might plug in 33,000 plants in my high-producing areas for corn, but for the less productive areas, I’ll back the population down to maybe 28,000,” Sutton says. The software then creates the prescription and zones based on those parameters.
Nitrogen (N) use is another major focus of the AirScout imagery, and Sutton says the N management tool is designed to delay N application until it’s clear that the plants can actually use it for greater yield.
“There’s no such thing as an average year,” he says, explaining why he doesn’t believe in using historical data to drive N applications. “If I want to put the nitrogen in the right spot at the right time, I need an image of now, today, right before I’m ready to put the nitrogen on, not whatever happened over the last 10 years.”
In addition, Sutton says that after trying for many years to boost production on the poorer ground, he realized it was a losing battle and that the key to higher overall yields was to boost production on the acres that have the potential to deliver.
So they apply enough N up front to get the plants growing, and then do a variable-rate side-dress pass based on an image taken at V7-V8.
“That’s the best way to be more productive,” he says. “We feed the good areas and back off on the others. I don’t want any more nitrogen out there than I have to have.”